Fresh Del Monte Produce Inc., the parent company of Del Monte pineapple operations on Oahu, reported record sales and profits for the first quarter of 2003. In a press release issued on April 29, 2003, the company announced a record breaking $107 million in gross profits from sales of $643.8 billion in the first quarter of 2003.
In fact, the company has been making strong profits since 1997, with record high profits in 1998, 2001, and 2002. In 2002, the
company’s gross profits hit an all time high of $337 million on worldwide sales of over $2 billion.
Profits have been so good, that the company has issued three cash dividends totaling $.25 per share this year. For the Abuhazaleh family, which own 56.6 percent of Fresh Del Monte stocks, these dividends add up to a little over $8 million in cash. The largest individual stockholder is Mohammad Abu-Ghazaleh, who is also the Chairman and CEO of the com-
pany. He holds 8.7 percent of DelMonteís stocks, which gives him a cash bonus of more than $1.2 million.
Pineapples and bananas
Operating under the commercial name of Del Monte Fresh Produce, the company is the world’s largest marketer of fresh
pineapples, third in the world for bananas, and leads in melons and grapes in the U.S. The company also has a growing share of the fresh-cut fruit and vegetables market in the U.S. and Europe.
About half of the company’s sales have come from bananas, but for the past five years, 86 percent of the profits have come
from pineapples, other produce, and fresh-cut items. As a result, the company has focused on diversifying away from bananas
and expanding its fresh produce and fresh-cut products.
Del Monte Fresh is vertically integrated, in that it grows, transports and markets many of its own products. The company operates its own farms, ships, processing and distribution centers.
The company grows pineapples on 9,400 acres in Hawaii and bananas and pineapples on 20,000 acres in Costa Rica. The
company also has extensive acreage in Guatemala, Brazil, and Chile where it grows bananas, melons, grapes, and non-tropical fruits.
North America continues to be Del Monte Fresh Produce’s biggest market, which accounts for 50 percent of its sales. Europe
accounts for 31 percent of the sales, followed by Asia and the Pacific with 17 percent of sales.
Del Monte Brand
Del Monte Fresh Produce sells its products under the Del Monte brand, with its familiar red and yellow design which looks a lot like a tomato. But it is only one of six separate companies that use the Del Monte label to distribute and sell a wide-variety of food products.

The name itself is owned by the Del Monte Corporation (dba Del Monte Foods), headquartered in San Francisco, which has granted perpetual, exclusive, royalty-free licenses for the use of the Del Monte name and trademarks to these other companies. Each of the companies have the exclusive right to use the Del Monte trademark in their territories or product category.
Del Monte Foods sells processed foods and beverages in the U.S. and South America under the brand name. Del Monte Fresh
Produce has the right to use the label on fresh produce worldwide. Del Monte Pacific Limited owns the Del Monte trademark in the Philippines and the brand rights for the India subcontinent. Del Monte Asia/Kikkoman has the Asia and Pacific markets (except for the Philippines and the Indian subcontinent). Cirio Del Monte sells Del Monte processed foods and beverages in Europe, the Middle East, and Africa. Kraft Canada sells Del Monte products in Canada.
Japanese are big shoppers; outspend other visitors
HONOLULU—Japanese visitors continue to outspend all other visitors by $70 a day, according to the latest research
data available from the State of Hawaii. The State collects the data by asking visitors from various areas to fill out a daily diary of all their spending which includes hotel, food, entertainment, travel, gifts, and everything else.
In the first quarter of 2003, Japanese visitors spent an average of $242 a day, compared to Mainland visitors from the East
Coast, who spent an average of $163 a day. Interestingly, West Coast Mainland visitors spent only $151 a day, significantly less than the East Coast visitor. Europeans spent an average of $162 a day and Canadians spent an average of $123 a day. (The
table below is for the year 2001 and shows a much higher figure for Canadians.)
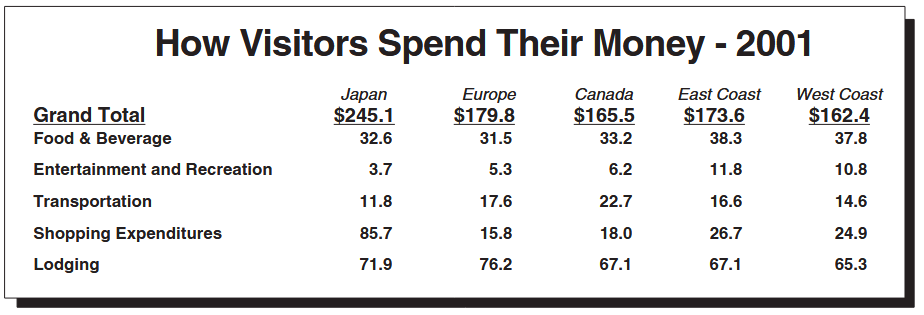
Shopping is the big difference
The biggest difference in spending patterns is that the Japanese spend much more shopping—particularly for leather goods,
fashion and clothing, and souvenirs. Details from the 2001 study revealed the average Japanese visitor spent $86 a day shopping, compared to the $26 in shopping for Mainland visitors. In other categories such as food at restaurants, transportation, and lodging, the Japanese spent about the same as other visitors. Entertainment spending was the exception, where the Japanese spent less than $4 a day compared with $11 for Mainland visitors.
The preliminary report is available at the Department of Business, Economic Development and Tourism’s website at:
http://www.hawaii.gov/dbedt/monthly/index.html
Look for the “2001 Annual Visitor Research Report” for detailed spending by categories.